

The Ultimate Source for Website Reports
There are a myriad of helpful reports available which will help you know how to improve your business website. However, there are some that we think stand out from the rest. And so… we offer you our top top 10 list.
Enjoy a FREE Website Audit Online in 30 Seconds. You’ll receive a breakdown of what you can anticipate from sitebundles.com when we compile your monthly website reports. Get a full website performance report for FREE by entering your website below. No signups or personal info needed.
1. Google Analytics
As many know, Google offers a free analytics service. With Google Analytics, a code is added to the website which allows website owners to track and create reports based on website traffic.
It’s quite the marketing tool. As a user of the platform, you can measure your advertising return on investment.(ROI). As well as track your website videos, flash, applications and even your social networking sites.
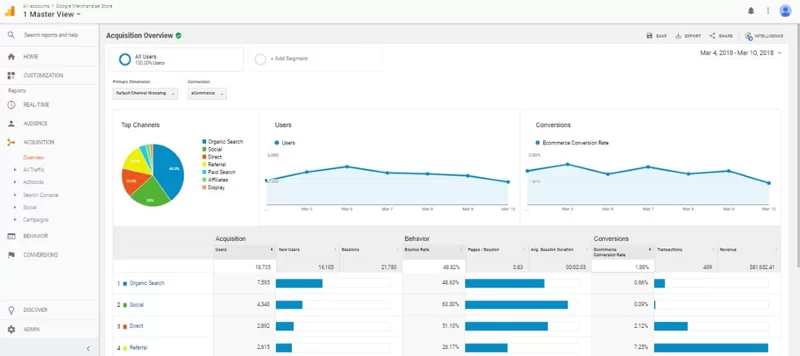
With Google Analytics, website owners and administrators can find the answers to commonly asked questions. Here are a few of the areas Google Analytics can help:
- How many visitors does my website get?
- What’s the location of my visitors – where are they from?
- What are my visitors using most and is mobile development a concern?
- Which websites are directing people to my website?
- What marketing strategies are bringing visitor traffic to my website?
- Which pages on my website are the most popular?
- What blog articles are viewed most by visitors?
- How many visitors have converted into leads or customers?
- How do converting customers navigate on the website – where do they go?
- Where do my converting visitors come from – what is their location?
- What can I do to improve my website’s speed?
With Google Analytics, you can dissect a website to be monitored and reported in a variety of ways. With the endless options for reporting, Google Analytics can answer almost any question that website owners and marketers come up with.
REAL TIME
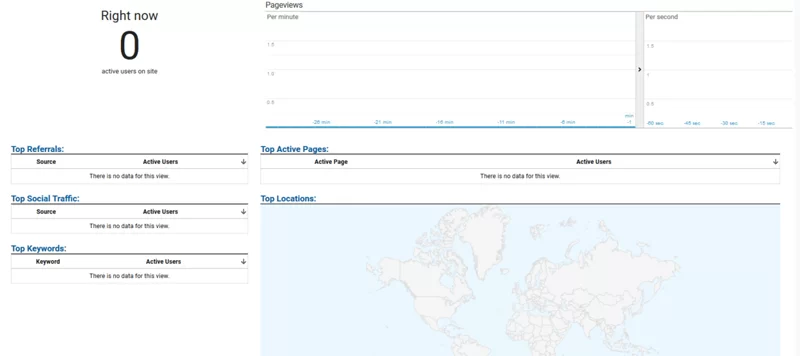
With the Real Time feature, data updates continuously to the overview dashboard. Each pageview is reported seconds after it occurs, giving you a real time overview of what visitors are doing on your website. With Real-Time, users can know the following:
- The number of visitors on your site right now
- Your visitors geographic locations
- The keywords and sites that referred your visitors
- Which pages your visitors are viewing
- Conversions of your visitors as they happen
AUDIENCE
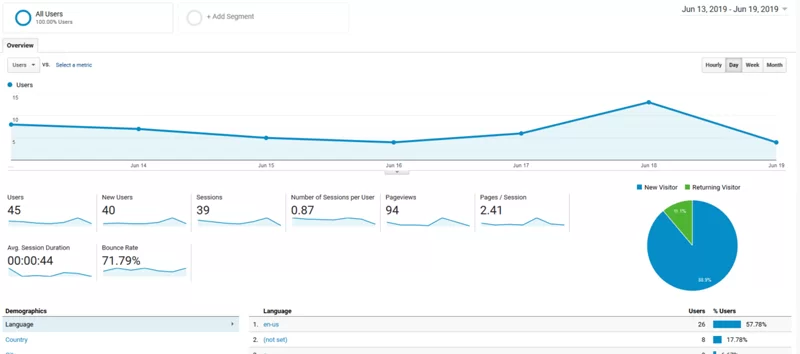
Within the Audience Reports, there are fifteen separate reporting sections – three of which are Beta at the time of this article. Each section features an easy-to-understand sessions graph which includes a table chart showing the acquisition, behavior and conversions data for each group.
The (15) segments in the Audience reports will help with the following:
- How many Active Users have been on your website
- The Lifetime Value (Beta) of a visitor
- A before and after comparison (over time) of website visitor activity
- Grouping visitors together in special groups, or audiences that share a common attribute
- Isolate and examine individual visitors
- Determine Age, and Gender of your website visitors
- Find out the special buying interests of your visitors
- Discover the location of your visitors and the language used
- See how many visitors, new versus returning visitors, are coming to your website and their frequency
- See what OS and Browser your visitors are using, along with the network that brought them to the website
- View website traffic based on Desktop and Mobile users
- Organize data across multiple devices into a cohesive analysis, so you get a better idea of how seemingly unrelated touch points, sessions, and interactions are connected
- Use custom variables to track and report website activity
- Find out how you are doing compared to your competition by viewing industry aggregated data
- See the flow of your users as they enter, browse and exit your website
AQUISITION
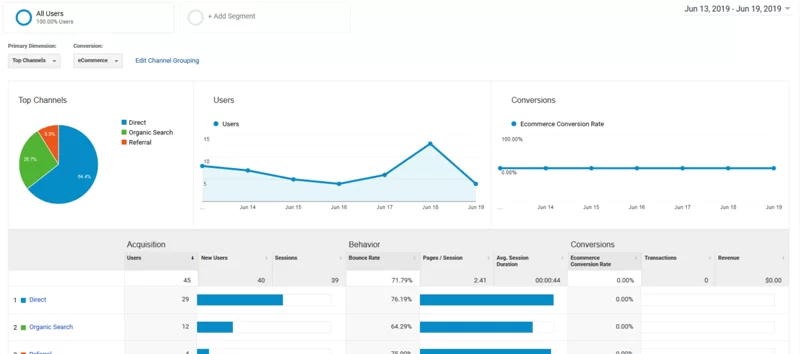
With the Acquisition reporting feature in Google Analytics. Website owners can measure the performance of various traffic sources through conversion analysis and behavior. Such as whether or not a visitor came from a paid marketing ad, a search query or even an advertisement on social media. Within the report, there are four main segments which dive deep into how your visitors were acquired.
These (4) main segments are:
- Google Ads
- Search Console
- Social
- Campaigns
BEHAVIOR
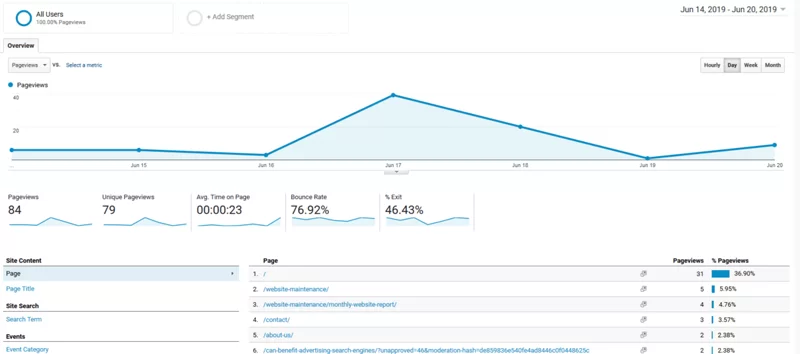
Google Analytics Behavior reports the behavior of your website visitors and their path to conversion. This report allows website owners and administrators to understand precisely how visitors interact with your site.
With the Behavior feature, there are seven segments included with the report which can be utilized. These (7) sections are:
- Determine which content is most engaging by seeing the behavioral flow visitors take on your website, from one page to the next
- Discover which of your site content is engaging and effective
- Evaluate your website’s speed and find improvements
- Review the search terms your visitors are using in the website search box
- Setup and monitor events taking place on your website by visitors
- Review Google AdSense ads and how well they are performing on your website
- Conduct experiments to improve goal conversion by testing different page designs
CONVERSIONS
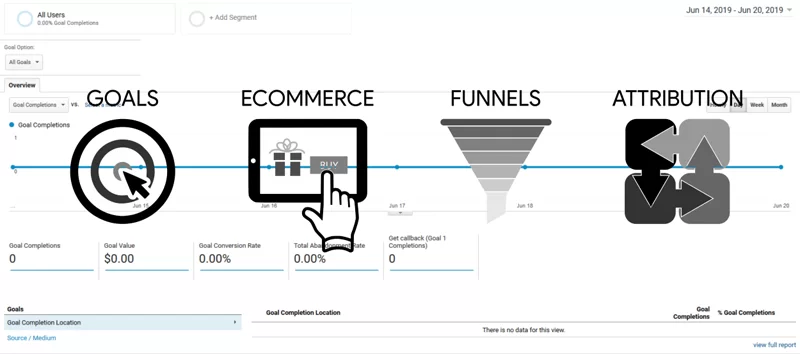
With Google Analytics Conversions, website owners and administrators can create and generate reports based on completed actions. These completed actions are when a visitor goes from being a visitor, into a customer. They convert from one to the other. How this process is determined is based on the definition of a conversion to a website owner. A conversion could be something simple as a visitor filling out a form on your website. Or, for the Ecommerce store, it could be the moment someone completes a purchase. A conversion could also be described as someone who has a high-level of engagement with your website, meeting a certain criteria of completed steps before being recognized as a customer.
With Google Analytics Conversions, there are four segments which will help you understand the conversion process of your visitors. These segments are:
- Goals
- Ecommerce
- Multi-Channel Funnels
- Attribution
CUSTOM REPORTS
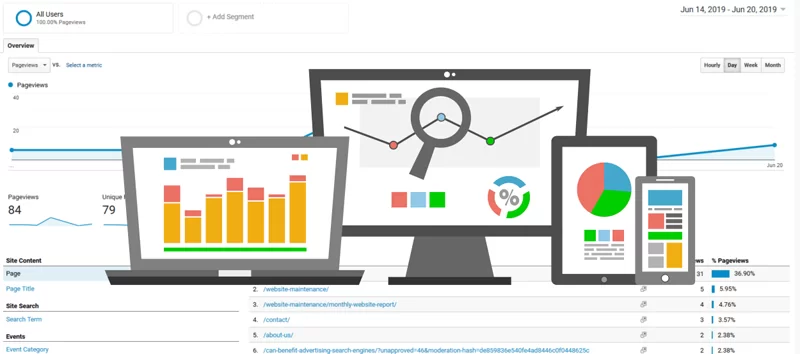
Setting up and dissecting website data involves time. There are alternatives which allow for custom reports to be made, freeing up time for website owners and administrators. Website data can be aggregated and reported. Custom reports are helpful for those who want to receive information about their website, but don’t have time to generate specialized reports. Having a reporting system in place like Google Analytics will help website owners and administrators understand their website performance, their visitors, and how users interact within the site. Having this information available allows for quicker and exact decision making, in addition to calculated marketing.
Whether you are hands on or have someone generate a customized report for you. The data is always necessary to help build a successful website.
2. Website SEO Audit Tool
The Website SEO Audit Tool is a free multi-purpose tool that evaluates and grades websites based on the strength of various SEO factors. The metrics are a valuable component for website developers who want to make their website perform better for users and rank better in search engines.
When a webpage or target URL is tested, the report will display an overall Grade using an A+ to F- scale.
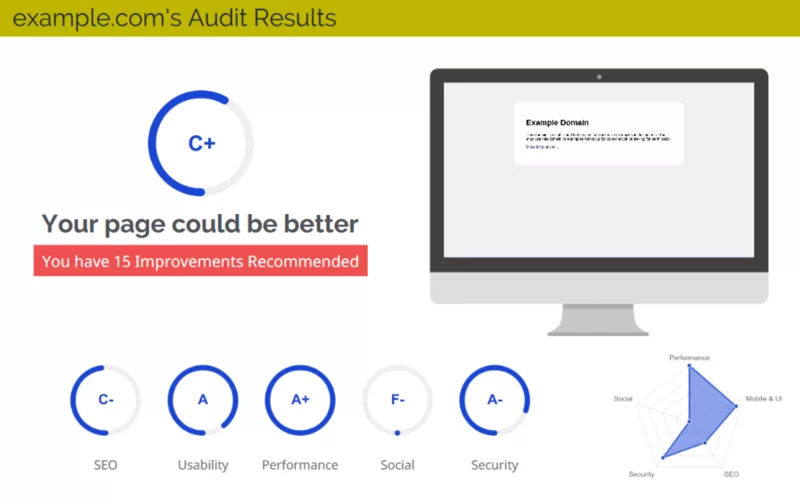
The testing process focuses on five key areas. These areas are:
- SEO
- Usability
- Performance
- Social
- Security
CHILD PAGES

Included with the test results will be a list of child pages found within the target URL. Child Pages are pages found within webpage, internal links that lead to posts or other pages. In the example above, there are no child pages found since the webpage serves as a single page demo site.
SEO RESULTS

The first of the five key areas tested deals with SEO. In this area, the Website Audit tool tests to see if your webpage is optimized from an SEO perspective. SEO optimization is important as it will enure a website can maximize its ranking potential and drive traffic to its website from search engines. Here are the factors that determine the SEO grade.
HTML HEADER
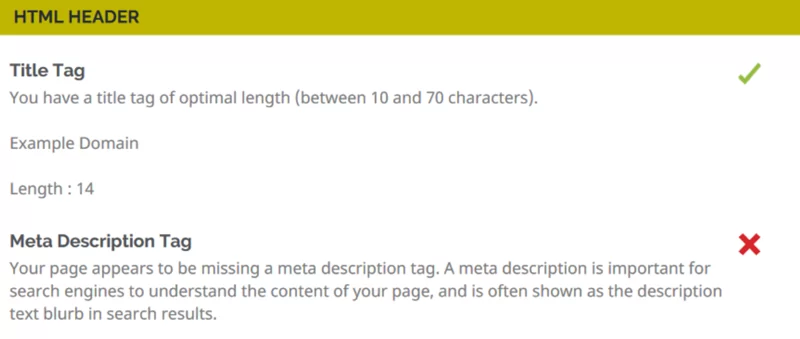
TITLE TAG
Title tags are titles for a page and are displayed within the serach results of a browser. A good title tag should correspond with the content on the page and be between 10 and 70 characters.
META DESCRIPTION
The meta description is the small blurb listed on the search results. This is the description below the title tag. The meta description is a small description about the content of the page, a summary of what is to be expected on that page. This description helps search engines understand the content of your page.
BODY CONTENT
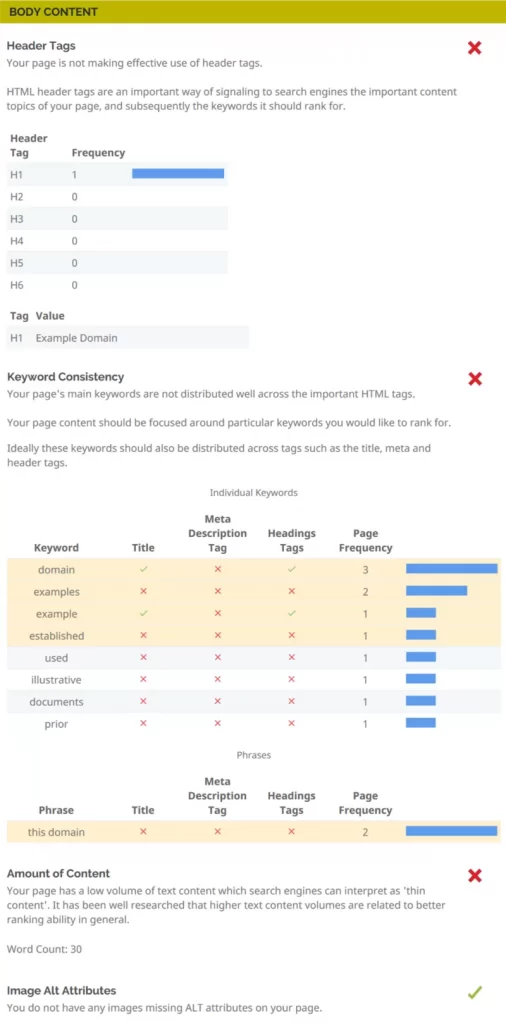
The Body Content section looks at how your content is formatted and displayed on the webpage. The Body Content section grades on the following areas:
- Header Tags
- Keyword Consistency
- Amount of Content
- Image Alt Attributes
HEADER TAGS
Headings are important on a webpage. The headings on a page separate the content and signals search engines the important content topics of your page, and the keyword the webpage should be ranking for.
KEYWORD CONSITENCY
Keywords are works that are used to describe the services, products, or information about your website. Consistent use of keywords tell search engines what your website is about. The keywords gathered from websites feed into the search engine’s algorythm and depending on the ranking value of the website, will display the results within a particular order. Keywords for a website should fall within the realm of the industry of the business. For instance, if someone sells clothing online – they will want to use keywords like “brand names, styles, genre and more.”
AMOUNT OF CONTENT
The amount of content on a webpage helps search engines with understanding what your website is about. If I were to give a single sentence about our company, and what we do. The reader may have a general overview, but surely not a clear and precise vision. If I were to create a few paragraphs highlighting who we are, how we started, what we are about and why we do what we do. The visitor would have a clearer understanding about us. The same with search engines, by having a content rich page, search engines can use the information to build a framework of what the page is about – directing visitors to you who have a need for that particular type of information.
IMAGE ALT ATTRIBUTES
Images play a role in the search results process. Images that are added to a website will be reviewed and used for placement within the results of a search query. It’s important to name your file to what the image is about and include a description of the image as a “alt” attribute. This is a hidden description of the image, used by search engines to gain knowledged of the image and what it’s about.
LINKS
The Links tool reviews and reports the statuses of links on the page, and websites referring links back to it.
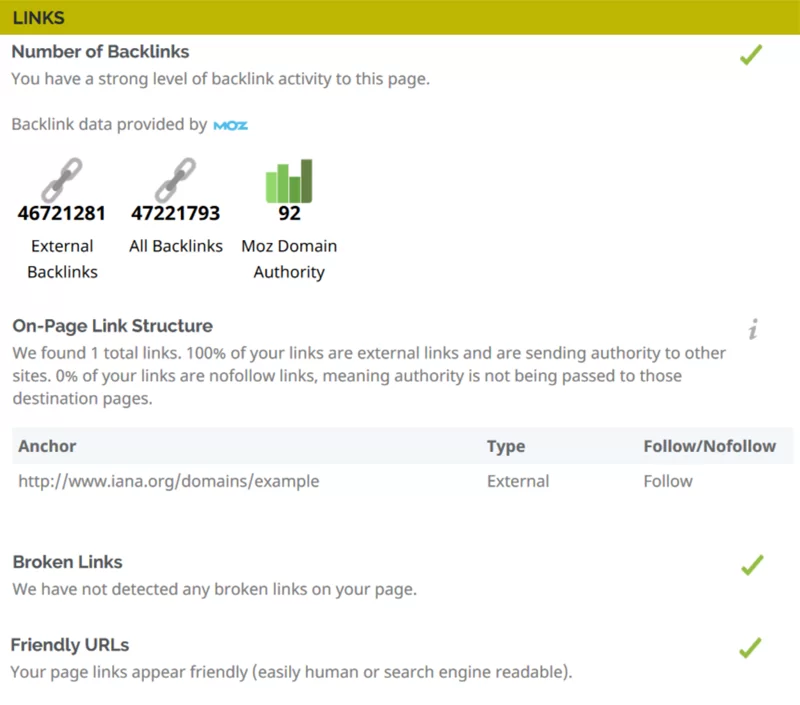
In addition, the links tool will review the page link structure. Looking to see if links are being followed or not, while at the same time checking for:
- Broken Links
- Friendly URLs
OTHER
The “Other” tool reviews and monitors a website for files that help with search engine instruction and traffic monitoring.
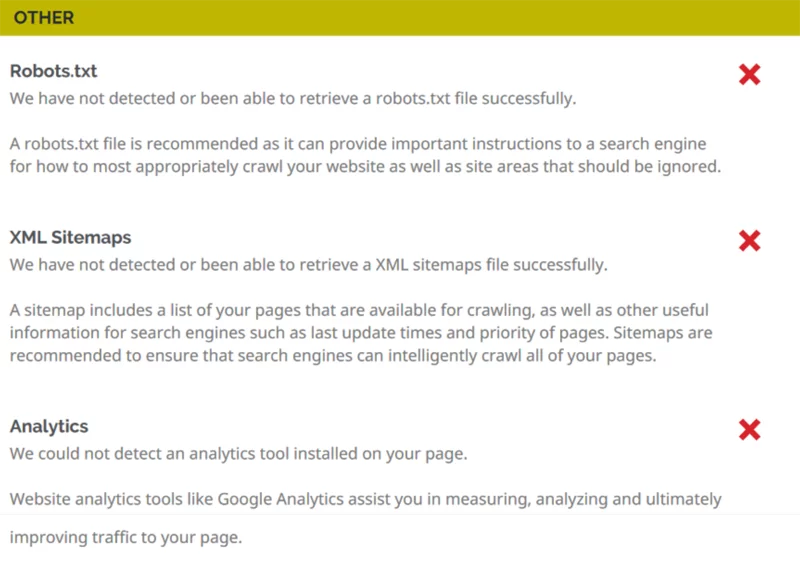
The areas of focus are:
- Robots.txt
- XML Sitemaps
- Analytics
ROBOTS.TXT
Whether or not the website being tested contains a robots.txt file. The robots.txt file is recommended for website, as it can provide important instructions to a search engine for how to most appropriately crawl a website – as well as site areas that should be ignored.
XML SITEMAPS
Checks to see if a XML Sitemap is included with the website. A sitemap includes a list of webpages that are available for crawling, as well as other useful information for search engines such as last update times and priority of pages. Sitemaps are recommended to ensure that search engines can intelligently crawl all of a website’s webpages.
ANALYTICS
Verifies whether your website uses an analytics tool like Google Analytics assist websites in measuring, analyzing and ultimately improving traffic to a website.
USABILITY
The Usability section covers how well your the website is used across devices.
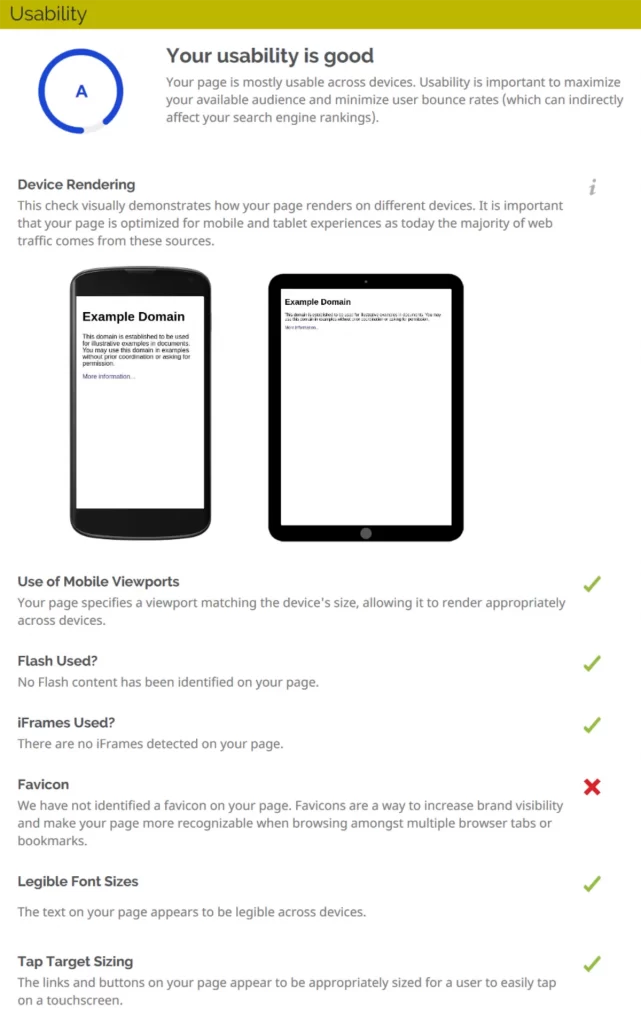
The tool gives a grade, using the A+ through F- scale. Websites that are built to be responsive will have content formatted for all viewing port sizes, allowing visitors the same level of experience regardless if they are on mobile device or desktop PC.
Areas of focus:
- Use of Mobile Viewports
- Flash Used
- iFrames Used
- Favicon
- Legible Font Sizes
- Tap Target Sizing
PERFORMANCE RESULTS
The Performance test reviews how well your website performs, both for speed and responsiveness.
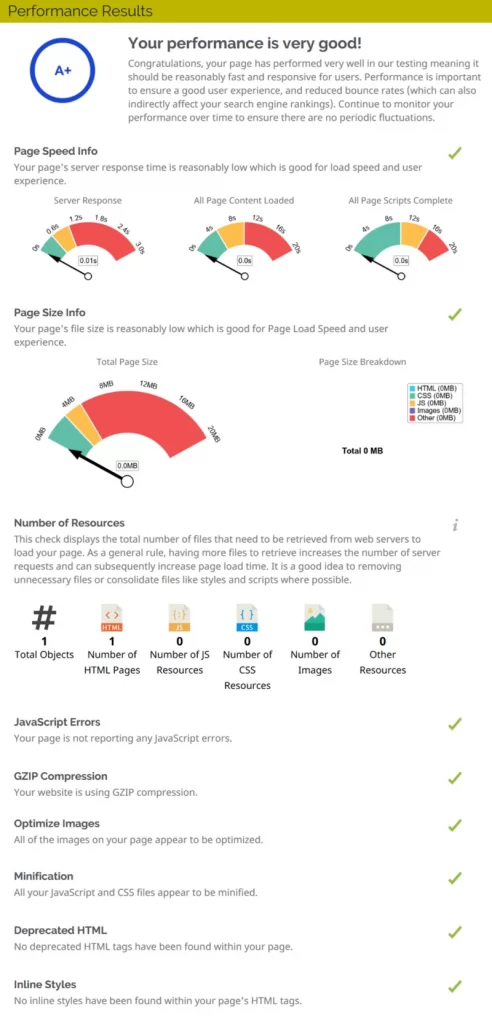
The test focuses on the following performance areas of your website:
- Page Speed Information
- Page Size Information
- Number of Resources
- JavaScript Errors
- GZIP Compressions
- Optimize Images
- Minification
- Deprecated HTML
- Inline Styles
SOCIAL RESULTS
